
Introduction
Biological assays play a critical role in ensuring the quality, safety, and efficacy of a pharmaceutical product throughout its lifecycle. More precisely, we may question whether the product is what it should be, how much of it is present, how well it works, and how free it is from unwanted material. This leads into the four groups of identity assays, content assays, potency assays, and aspect of product quality. Together, these categories support batch release and stability by confirming the molecule’s authenticity, controlling its strength and activity, and managing risks to safety and performance. Methods in each category are expected to be fit for purpose and validated according to the International Council for Harmonisation (ICH).
In the following, we provide a brief summary to the four assay types and how to can tackle them with PLA 3.0.
Identity assays
Identity assays make sure that the biological material in a sample is
the intended product, thus are of qualitative nature. Because tests must
be highly specific to the molecular structure, identification can be
achieved through techniques like infrared spectroscopy or antibody
binding. Additional analysis by biostatistics software like PLA 3.0,
which focuses on quantitative methods, is usually not necessary.
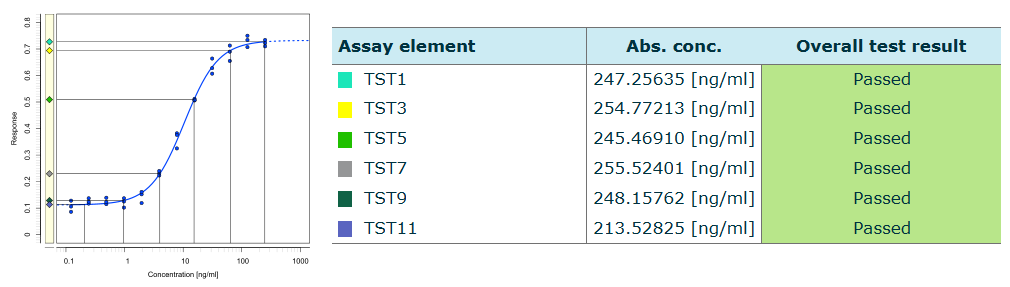
Content assays
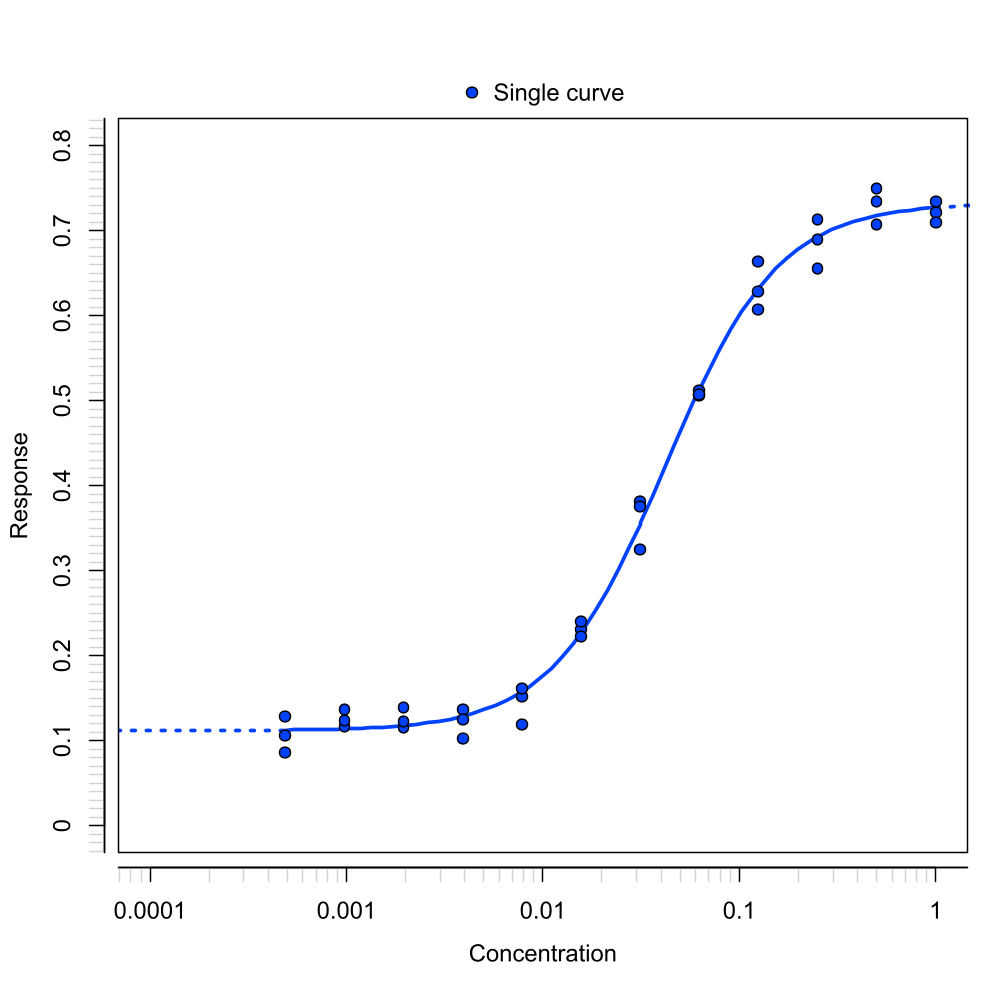
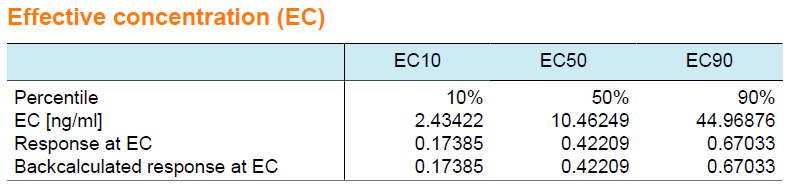
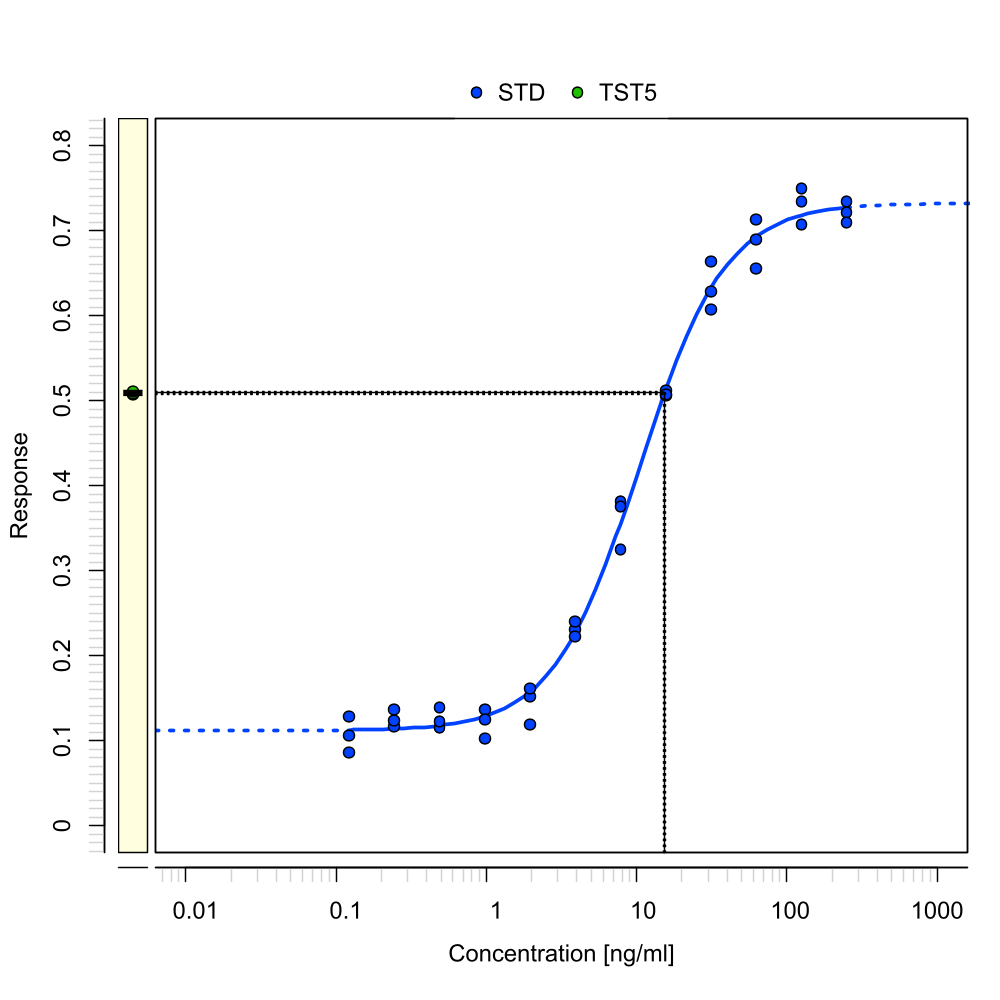
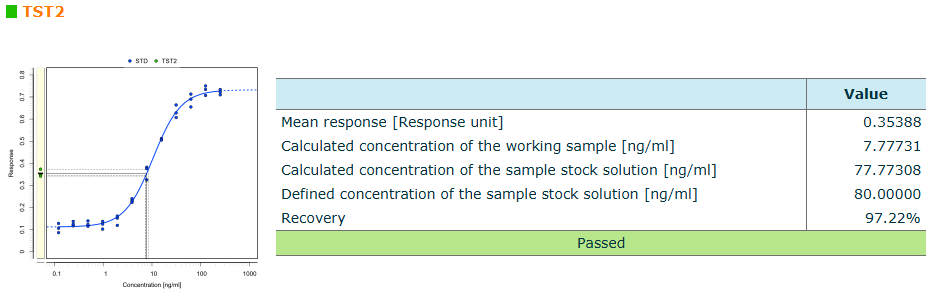
Content assays establish how much of the intended analyte or defined active component is present in a product in relation to the produced biological effect. Thus, typically referred to as dose-response analysis. In this category fall several analytical applications also covered by the Dose-Response Analysis Package of PLA 3.0:
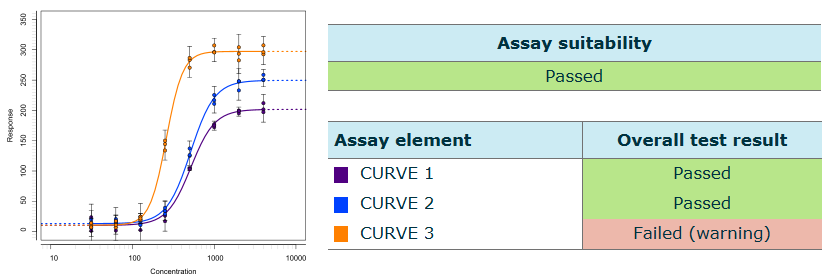
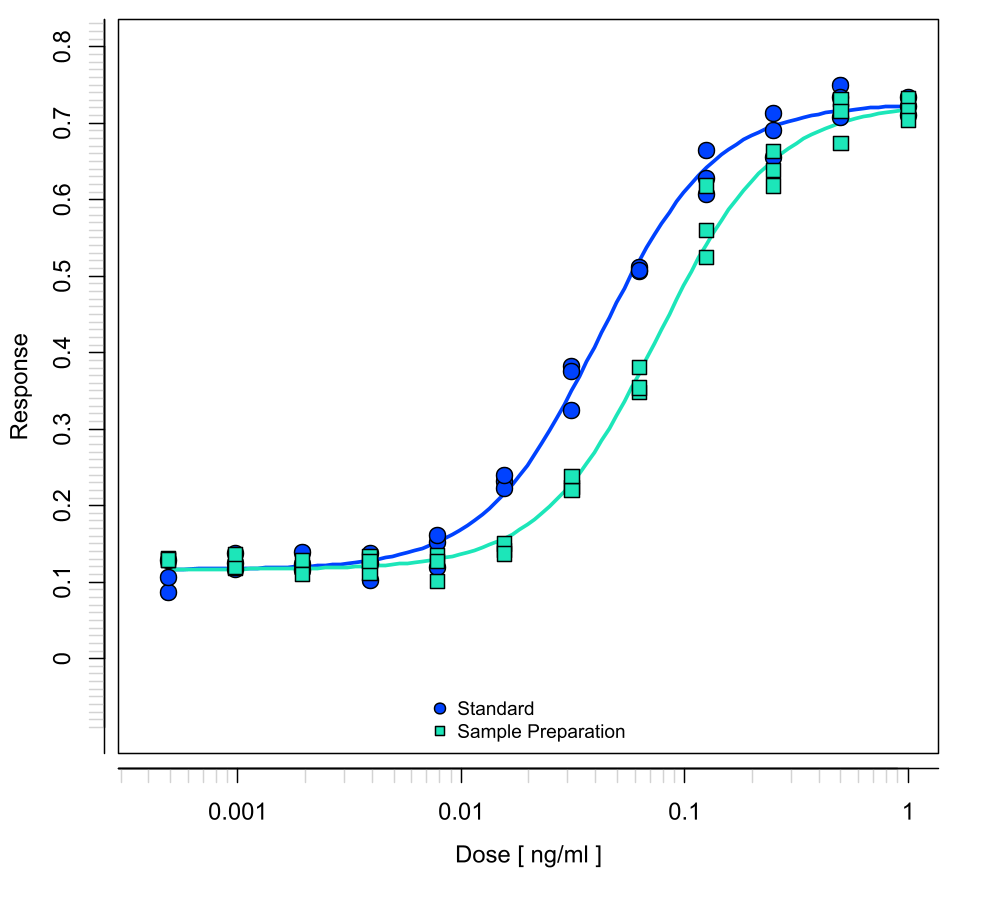
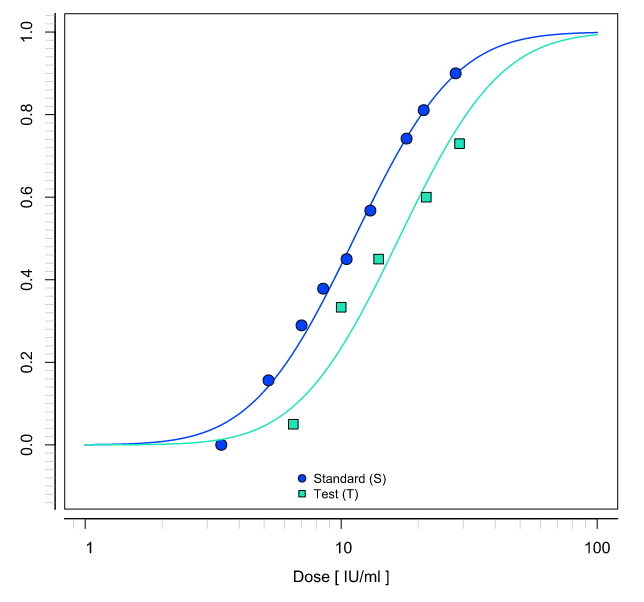
Potency assays
Potency assays are used to determine the biological activity of a
pharmaceutical product assuring consistent performance throughout its
lifecycle. They are a critical element of quality control, particularly
for biological and biotechnological products where structure alone may
not fully predict activity. Potency is typically measured against a reference standard
and expressed as relative potency. Similarity of the two curves
therefore play an important role, requiring a well-defined test system.
PLA 3.0 provides methods for quantitative response assays, dichotomous
assays, and microbial assays to determine the potency of a product.
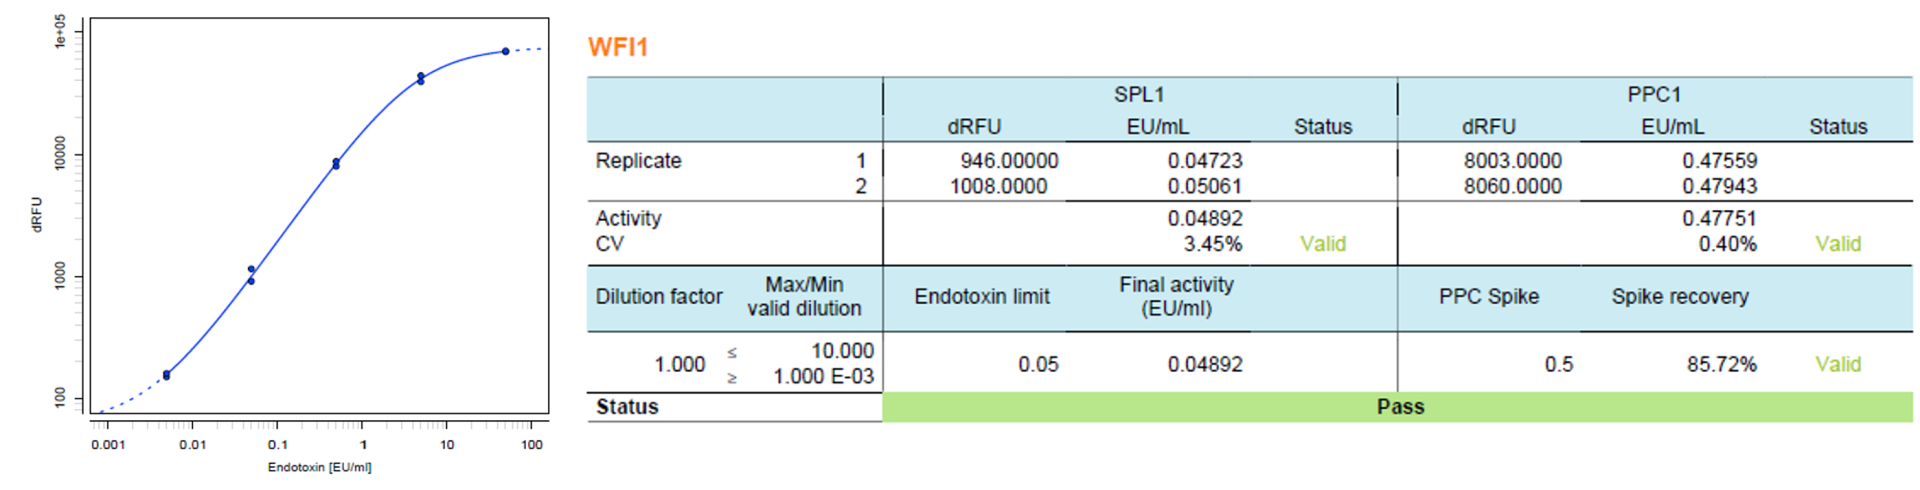
Impurity assays
Impurity assays detect and quantify unwanted materials in a biological product that could impact safety, efficacy, or stability. The major difference to other approaches is an expected ‘no signal’ as response. Meaning that the product is free from contaminations. Such assays typically utilize product controls to eliminate false-negative or false-positive results. Results are used for release and stability, and are trended to identify process drift or emerging degradation. PLA 3.0 currently supports rFC-based endotoxin detection assays, following the methodology suggested by bioMérieux.
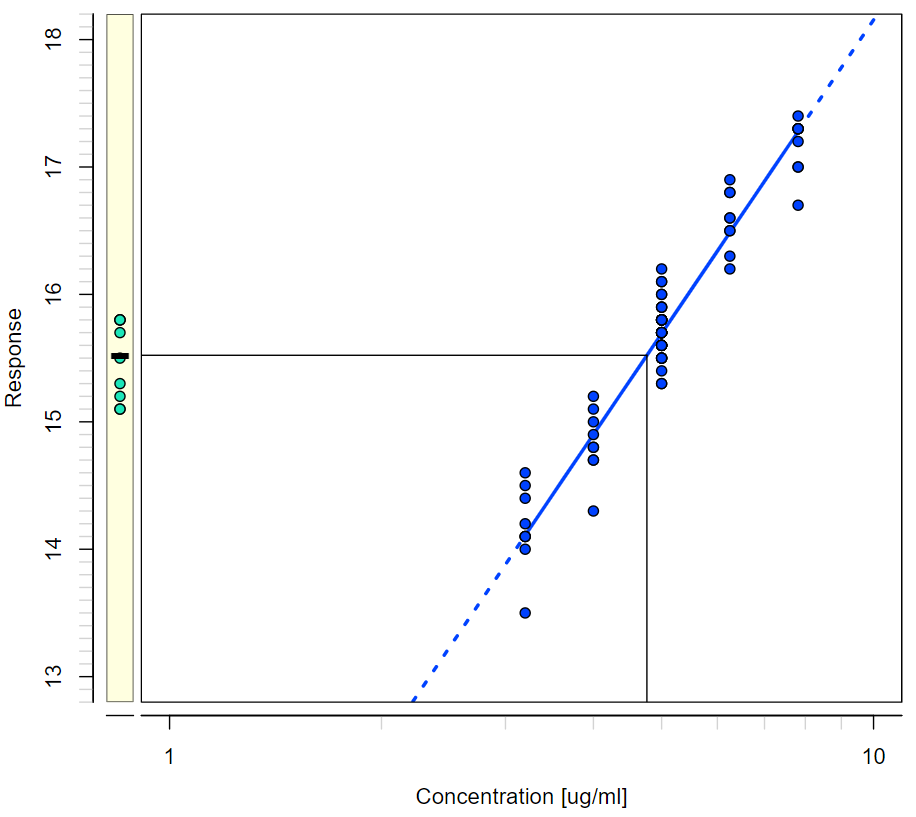
rFC-based endotoxin detection assays
are an animal-free variant to detect lipopolysaccharide endotoxin from
Gram-negative bacteria via a fluorometric readout. The analytical method
of PLA 3.0 includes the linear and 4-parameter logistic models for endotoxin concentration estimation. It also contains tools to control the measurement system, for example, gain optimization, morning test, and uniformity test.
Continue exploring

Data analysis

PLA 3.0 for Method Developers
